Stop Building Dashboards.
Start Building Data Products.
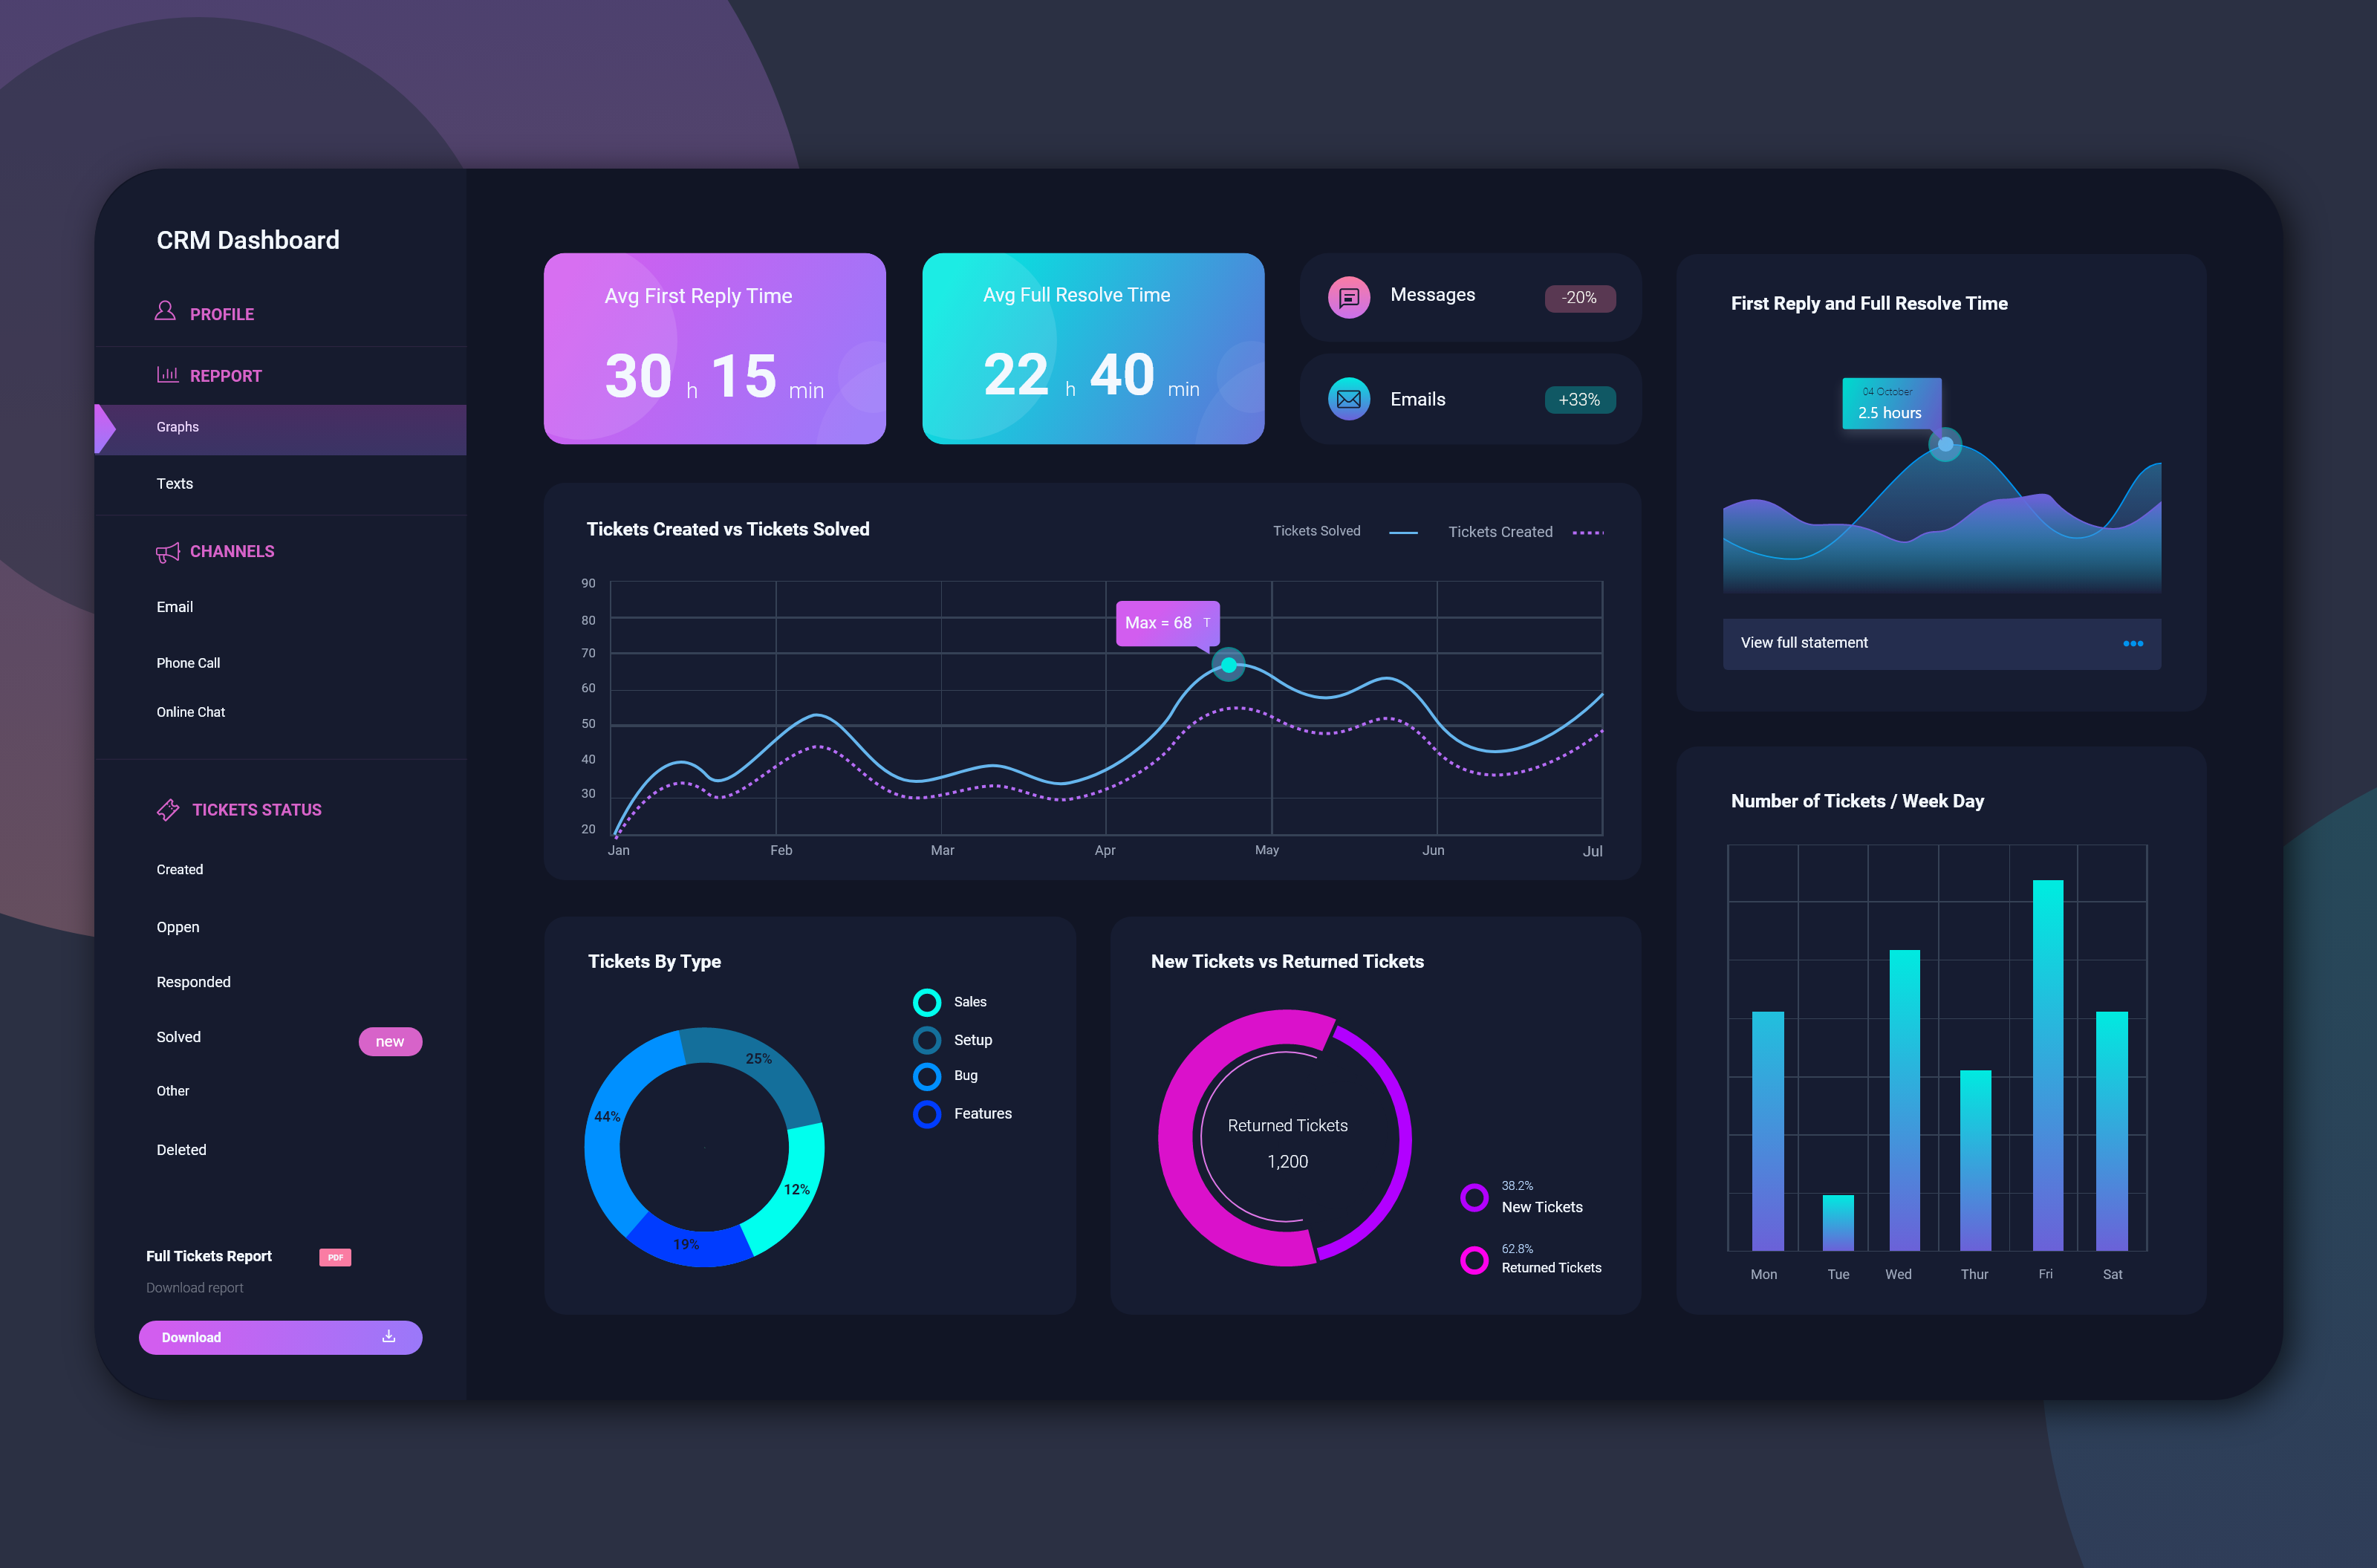
Here is a controversial take that might ruffle some feathers: Dashboards are failing your organization.
You have seen it before. A business stakeholder requests a "quick dashboard." Your data team spends weeks cleaning, modeling, and building beautiful visualizations. You launch it with a flourish. Everyone claps.
And then... nothing happens.
The dashboard sits in a shared folder, forgotten. The stakeholder looks at it once, says "cool," and goes back to making decisions based on gut feelings. Three months later, they request another dashboard. The cycle repeats.
This is not a failure of your data skills. It is a failure of strategy. You are building dashboards. You should be building Data Products.
In this guide, I will show you the difference between these two approaches and why making this mental shift will transform you from a "report builder" to a "strategic partner."
What is a Dashboard? (The Problem)
A dashboard is a static visualization tool that displays predefined metrics. It answers a specific question you already thought to ask.
Characteristics of a Dashboard:
-
Passive: Users look at it. That is it.
-
Static: It shows what happened yesterday (or last hour), but it does not change behavior.
-
One-Way: Data flows from the warehouse to the screen, but the user cannot interact with it in a meaningful way.
-
Disposable: The moment the business question changes, the dashboard becomes obsolete and needs to be rebuilt.
The Dashboard Trap:
Dashboards encourage passive consumption. Stakeholders look at data. They rarely do anything with it. You are building expensive "digital wallpaper" that no one uses to drive action.
What is a Data Product? (The Solution)
A data product is not a visualization—it is a system that turns data into an action. It is designed to be consumed by other systems, applications, or humans to make real-time decisions.
Key Characteristics of a Data Product:
-
Active: It drives action automatically.
-
Dynamic: It adapts to user behavior and context.
-
Two-Way: It takes inputs, processes them, and returns meaningful outputs or recommendations.
-
Reusable: It is built as a modular component that can be used across multiple use cases.
-
User-Centric: Every feature exists because a specific user needs it to accomplish a specific goal.
-
Governed: It comes with clear ownership, SLAs, and quality expectations.
Data products operate like internal or external products—they are designed with user journeys, data contracts, and "product thinking" baked into every layer of the stack.
Dashboard vs. Data Product: The Head-to-Head
| Feature | Dashboard | Data Product |
|---|---|---|
| Primary Function | Visualize and monitor data | Drive action, generate insights, or power other systems |
| Interactivity | Limited filters and drill-downs | Full interactions, APIs, alerts, and integrations |
| User Type | Analysts and managers | Everyone—analysts, operations, customers, and other systems |
| Lifecycle | Built once, updated rarely | Continuously improved and iterated |
| Value | Informs decisions | Enables decisions and actions at scale |
| Technical Output | Charts and tables | APIs, feature stores, recommendation engines, and automated workflows |
| Ownership | Often owned by a BI team with unclear accountability | Product-owner model with clear KPIs and roadmaps |
| Scalability | Scales poorly across teams | Designed to scale with the business and tech stack |
| Monetization | Indirect (if at all) | Direct—often tied to revenue, efficiency, or competitive advantage |
| Example | Revenue dashboard with charts | An API that calculates customer lifetime value in real time and feeds it into your CRM |
Why Every Data Engineer Should Care About Data Products
Here is the honest truth: Data engineers are usually invisible.
You build the pipelines, maintain the infrastructure, and keep the data flowing. Then a dashboard is built by an analyst, and the business applauds them. You are the plumbing, and no one notices the pipes until they break.
Building Data Products changes this. It makes your work visible, valuable, and indispensable.
Real-World Examples of Data Products (vs. Dashboards)
Example 1: Customer Churn
| Dashboard Approach | Data Product Approach |
|---|---|
| A chart showing monthly churn rate | An automated model that predicts which customers are likely to churn next week and triggers a retention workflow in your CRM |
| Users can see churn is rising | The system acts—sending a discount or a personalized outreach email automatically |
Example 2: Inventory Management
| Dashboard Approach | Data Product Approach |
|---|---|
| A dashboard showing stock levels across warehouses | An API that recommends optimal reorder quantities and automatically places purchase orders when stock drops below a threshold |
| Supply chain managers refresh the page | The system prevents stockouts before they happen |
Example 3: Marketing Attribution
| Dashboard Approach | Data Product Approach |
|---|---|
| A dashboard showing marketing channel performance | A data product that dynamically adjusts ad spend allocation across channels in real-time to maximize ROI |
| Marketers analyze the data and make slow decisions | The data product makes decisions at machine speed |
How to Start Building Data Products (A 4-Step Framework)
Step 1: Think Like a Product Manager
Before you write a single line of code, ask:
-
Who is the user? (It can be an internal analyst, a customer-facing app, or another team.)
-
What job does this product do for them? (Does it automate a painful manual process, or does it create new capability?)
-
How will they use it? (API call, automated alert, embedded widget, ML model inference?)
-
What success looks like? (What metric improves? Fewer manual reports? Faster decisions? Revenue uplift?)
Shift in mindset: A data product is a solution to a user problem, not a visualization of data.
Step 2: Build Modular, Reusable Components
Instead of building a pipeline and then a separate dashboard for each department, invest in a modular architecture that can support multiple use cases. Build an API or a feature store once and reuse it across teams.
Step 3: Embed Data into the Workflow
Do not make users come to the data. Bring the data to them.
-
Push recommendations directly into Salesforce.
-
Embed fraud scores into the payment gateway.
-
Send alerts to Slack when anomalies are detected.
The Goal: The data product should feel like an invisible assistant that makes the user's job easier, not another app to check.
Step 4: Measure the Right Things
Do not measure your data product by "number of views" or "number of queries." Measure business outcomes.
| Bad Metric | Good Metric |
|---|---|
| Dashboard views | Revenue generated from recommendations |
| Number of queries run | Manual hours saved by automation |
| Pages loaded | Customer retention rate improved |
The Role of Data Engineers in Building Data Products
Data engineers are in the perfect position to lead the shift toward data products. You understand the underlying pipelines, performance bottlenecks, and cost implications. Translating that understanding into product thinking makes you one of the most valuable members of any data team.
You also have the opportunity to define data contracts—ensuring that your data product delivers reliable, well-documented, and governed data to its consumers. This reduces friction and builds trust.
The Bottom Line: Start Your Shift Today
Building dashboards is easy. Building data products is hard. But it is also 100x more valuable to your organization and your career.
When you build data products, you stop being the "person who makes reports" and become the "person who drives revenue, efficiency, and innovation." That is the kind of engineer who gets promoted, not just assigned to the next dashboard request.
Your Action Plan for This Week:
-
Identify a dashboard you built that no one uses. Ask why.
-
Find one manual process in your company that is still done using spreadsheets or gut feeling. (There is always one.)
-
Propose a data product to automate it. Start small—a simple API or an automated alert is a great first step.
-
Start the conversation. Talk to your stakeholders about outcomes, not outputs. Ask them: "If you could magically solve one problem with data, what would it be?"
The future of data engineering is not in charts. It is in systems that think, act, and deliver value without anyone clicking "refresh."
Contact Us
Phone: +91 9667708830
Email: info@codingnow.in
Website: https://codingnowai.in/
Address:
2nd Floor, Kapil Vihar (Opp. Metro Pillar No.354)
Pitampura, New Delhi – 110034
Backlink to main website: Explore Python and AI courses at Coding Now – Gurukul of Ai