Move from raw data to boardroom-ready insights with the Data Analytics with Excel & Power BI Certification Training. This program is precisely designed for Business Analysts, Finance Professionals, and Operations Managers who need to go beyond basic spreadsheets and master the end-to-end analytics workflow used by industry leaders.


 27450 Learners
Go beyond basic Excel formulas with our 70% hands-on curriculum focusing on real business datasets.
Secure your certification with confidence by mastering Power BI dashboards and advanced DAX measures.
Learn from active data professionals using real-world business intelligence and reporting workflows.
After years of producing static reports from disconnected spreadsheets, your career growth may be limited by outdated tools. The modern analytics landscape demands dynamic, visual, and self-service reporting.
✔ 70% project-based learning approach with real-world business datasets and end-to-end dashboard case studies.
Learn Advanced Excel, Power Query, Power Pivot, Power BI, DAX, Data Modeling, and Interactive Dashboard Design.
Suitable for graduates, business analysts, finance professionals, managers, and anyone working with data in their day-to-day role.
Build industry-level dashboards and reports using real business datasets across finance, sales, and operations.
Resume building, mock interviews, portfolio development and placement assistance included.
Tailored programs for teams with enterprise support
Choose from digital or instructor-led training for a customized learning experience.
Access enterprise-grade LMS systems built for scalability and security.
Flexible pricing plans for teams of every size.
Track team progress with detailed dashboards and reports.
Dedicated support whenever your learners need help.
Dedicated account managers ensure smooth training delivery.

Get a custom quote for your organization's analytics training needs.
From Raw Data to Actionable Business Intelligence
Go beyond VLOOKUP. Master INDEX-MATCH, XLOOKUP, array formulas, dynamic arrays, and Power Query to automate data preparation workflows at scale.
Build robust relational data models using Power Pivot, establish table relationships, and create reusable calculation layers that power enterprise-grade reports.
Write professional DAX expressions including time intelligence functions, running totals, YoY comparisons, and complex KPI calculations for business reporting.
Design visually compelling, interactive Power BI dashboards with slicers, drill-throughs, bookmarks, and dynamic visuals aligned to executive reporting standards.
Use Power Query Editor to cleanse, reshape, merge, and transform raw data from multiple sources into analytics-ready datasets without a single line of code.
Translate complex datasets into clear narratives using chart best practices, conditional formatting, and executive-ready presentations that drive decisions.
Ideal Candidates for Data Analytics with Excel & Power BI Certification
Designed for professionals who work with data daily but want to unlock the full power of Excel and Power BI, this rigorous training builds the technical mastery required to secure a Data Analytics designation. Gain the credentials and skills necessary to qualify for both foundational and senior-level analytics opportunities.
The Step-by-Step System for First-Attempt Certification Success
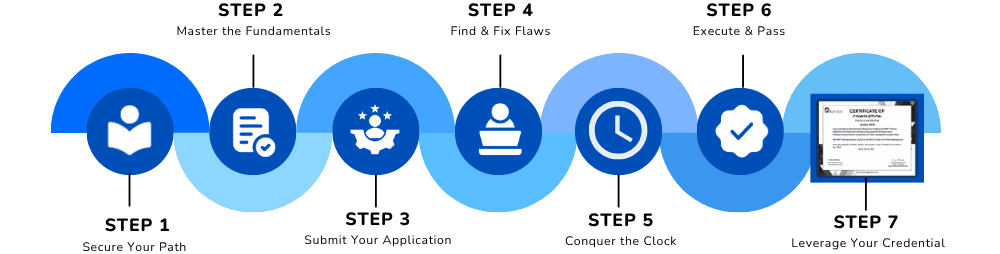
Solidify your path by establishing a rigorous 6-week study plan designed for rapid Excel and Power BI mastery.
Data Analytics Certification Requirements
Objective: To certify your practical expertise in business intelligence and data analytics within the Microsoft ecosystem. Candidates must demonstrate proficiency across the following pillars:
Successful completion of a rigorous curriculum covering advanced formulas, Power Query transformations, and pivot table analysis across complex multi-source datasets.
The ability to design, publish, and optimize Power BI reports using calculated DAX measures, data models, and interactive visual elements for stakeholder consumption.
A deep understanding of how to translate business questions into structured analytical frameworks and executive-ready dashboard solutions.
Comprehensive modules covering all knowledge areas
Navigate Excel efficiently, master essential functions, keyboard shortcuts, and data entry best practices.
Structure and style data professionally using Excel Tables, conditional formatting rules, and named ranges.
Master every major lookup technique and understand when to use each for accurate data retrieval.
Leverage FILTER, SORT, UNIQUE, and SEQUENCE to build self-updating dynamic report structures.
Group, filter, calculate, and summarize large datasets using professional PivotTable techniques.
Create interactive Excel dashboards using slicers, timeline filters, and dynamic PivotChart visuals.
Import data from Excel files, CSVs, databases, and web sources using Power Query connectors.
Remove errors, unpivot columns, merge queries, and create reusable automated data refresh pipelines.
Connect multiple tables, define relationships, and create efficient star and snowflake schemas.
Write calculated columns and measures using core DAX functions inside Power Pivot.
Design KPIs, date hierarchies, and drill-down structures for multi-level analytical reporting.
Connect Power BI to multiple data sources and navigate the report, data, and model views.
Design bar charts, line charts, maps, matrix visuals, cards, and custom visuals for business reporting.
Understand row context vs filter context and master CALCULATE, FILTER, ALL, and RELATED functions.
Build YTD, MTD, QTD, YoY, and rolling average measures using DAX time intelligence functions.
Publish reports, configure workspaces, set up scheduled refresh, and manage data gateway connections.
Pin tiles, build Power BI Apps, and configure row-level security for controlled data access.
Build sales performance dashboards tracking revenue, pipeline, churn, and customer lifetime value.
Design P&L reports, budget vs actuals, inventory analysis, and supply chain performance dashboards.
Build a complete production-ready Excel and Power BI analytics solution from raw data to executive dashboard.
Solve business challenges from retail, banking, healthcare, and e-commerce analytics sectors.
Lifetime Access
Real Projects Included
Mentor Support
Practice Assignments
Certificate Preparation
Join 27,000+ successful professionals who transformed their careers with our industry-recognized certification.
✅ Limited seats available for upcoming batch • EMI options available
Insights on AI, Data Science, Full Stack & Career

Have you ever wondered how AI can understand that "puppy" and "dog" are related, or that "king" and …
Read More →
If you have used a recommendation engine, searched for something online, or chatted with an AI assis…
Read More →Rank on Google's first page in 30 days? Yes—if you're strategic. This realistic guide covers low-c…
Read More →