Roadmap to Become a Power BI Expert in 2026
Power BI has evolved far beyond a simple reporting tool. In 2026, it is a full analytics ecosystem encompassing data engineering, semantic modeling, AI, and enterprise governance . This roadmap will guide you from the fundamentals through the advanced skills that separate true experts from report builders.
Phase 1: Master the Fundamentals
Understand the Power BI Ecosystem
Start by understanding the core components. You don't need to be a programmer to build useful reports, but knowing the flow is essential :
-
Power BI Desktop – The free application where you build reports on your computer
-
Power BI Service – The cloud platform for sharing and viewing reports
-
Power BI Mobile – Apps for checking dashboards on mobile devices
-
Power Query – The tool for cleaning and preparing data
-
DAX – The formula language for advanced calculations
Connect to Data
Learn to connect Power BI to various data sources: Excel, SQL Server, CSV files, SharePoint, APIs, and cloud services . A key skill is combining several sources into one cohesive model.
First Hands-On Steps
In your first week, open Power BI Desktop, import a simple dataset, build a basic report with 2-3 visuals, and experiment with filters, slicers, and simple transformations . This is about building comfort, not mastery .
Phase 2: Data Transformation with Power Query
Clean data is the foundation of trustworthy analytics. Clean it, or it will betray you. Power Query lets you import, clean, transform, and shape data without altering the original system .
Core Power Query Skills
-
Connect and Profile: Choose your source and inspect column quality and distribution
-
Transform: Remove duplicates, split/merge columns, pivot/unpivot, fill nulls, and create calculated columns
-
Document and Validate: Name steps clearly in the Applied Steps pane for transparency. Preview results before loading
Pro Tip: Power Query is non-destructive—you can refine steps anytime and reliably refresh clean data across projects . It is a must-have skill for any modern analyst .
Phase 3: Data Modeling (The Real Differentiator)
This is where experts separate themselves. Most analysts get stuck at visualization; top analysts think in data architecture and performance trade-offs . Dashboards look good, but very few are actually correct .
What to Learn
-
Star Schema Design: Organize tables into fact and dimension tables for fast, accurate analysis
-
Relationships: Create one-to-many, many-to-many relationships and choose cross-filter directions
-
Calculation Groups: For managing multiple DAX calculations efficiently
-
Performance Tuning: Understand query folding, aggregations, and incremental refresh to keep reports fast
Key Insight: If the data model is incorrect, Copilot suggestions and AI insights will be wrong. Speed has improved, but responsibility has not . Deep data modeling knowledge is the foundation of everything .
Phase 4: Master DAX (Data Analysis Expressions)
This is where real analytical power lives . Move beyond SUM and AVERAGE. Focus on time-intelligence, filter context, row context, and pattern-based DAX .
Essential DAX Skills
-
Core Functions:
SUM,AVERAGE,CALCULATE,FILTER,DATEADD -
Time Intelligence: Year-to-Date, period-over-period growth, cohort analysis, rolling averages
-
Context Understanding: Master the difference between filter context and row context
Practice Tip
Build measures for real KPIs: Total Sales, YTD Sales, YoY Growth. Validate results against known totals . In an interview, you might be asked to write a CALCULATE expression from scratch or explain filter context .
Phase 5: Create Interactive Visualizations and Dashboards
Choose visuals that clarify the story, not complicate it .
Visuals to Master
-
Bar/Column Charts: Ranking and comparison
-
Line Charts: Trends over time
-
Treemaps and Stacked Charts: Composition/parts-to-whole
-
Maps: Geospatial analysis (including Azure Maps)
-
Slicers and Filters: Intuitive, interactive filtering
-
Tables and Matrices: Detail and pivot views
Advanced Report Design
-
Bookmarks and Drill-through: For narrative flow and self-service exploration
-
Accessibility: Alt text, screen-reader tab order, color-contrast compliance
-
Corporate Theme JSON: Ensure visual consistency across all reports
-
Action-Oriented Design: One key decision per page
Mindset Shift: Think like a business partner, not a tool specialist. Build dashboards around user journeys: executive overview → drill-down → action points . If leadership uses your reports in every key meeting, you are doing it right .
Phase 6: Enterprise Governance and Administration
Slow, unreliable reports kill adoption . As you move to expert level, you need to manage Power BI at scale.
Key Skills
-
Row-Level Security (RLS): Control which data users can access
-
Object-Level Security (OLS): Restrict access to specific columns/tables
-
Workspaces and Apps: Organize and distribute content effectively
-
Deployment Pipelines: Manage the lifecycle from development to production
-
Data Gateway and Scheduled Refresh: Keep reports up-to-date securely
-
Incremental Refresh: Optimize large dataset refreshes
Phase 7: AI and the Modern Ecosystem
Leverage AI to tell a smarter story with your data. Power BI is now integrated with Microsoft Fabric, unifying data engineering and analytics .
What's New in 2026
-
Copilot in Power BI: Generate visuals, suggest measures, and summarize reports faster using natural language
-
Anomaly Detection and Smart Narratives: AI-driven insights that highlight outliers
-
Integration with Azure and Fabric: For enterprise-grade analytics across the entire data pipeline
-
External Tools: DAX Studio, VertiPaq Analyzer, and Tabular Editor for performance tuning and complex scripting
Important: Copilot works on top of your data model. If the model is incorrect or relationships are poorly defined, the output will be wrong .
Certification Path
The primary certification for Power BI is the Microsoft Certified: Power BI Data Analyst Associate. This validates your skills in modeling, visualizing, and analyzing data with Power BI.
Recommended Microsoft Learn Learning Paths (in order)
-
Get started with Microsoft data analytics – Introduces the role and flow
-
Prepare and visualize data with Microsoft Power BI – Core skills for connecting, cleaning, and visualizing
-
Prepare data for analysis with Power BI – Deep dive into Power Query
-
Model data with Power BI – Data modeling and DAX fundamentals
-
Build Power BI visuals and reports – Report design and UX
-
Manage and secure Power BI – Workspaces, security, and sharing
Optional: PL-300 Course
Consider the instructor-led course PL-300T00-A: Design and manage analytics solutions using Power BI for structured, exam-aligned training . Hands-on practice is crucial. Watching tutorials is not the same as solving real problems
Final Thought
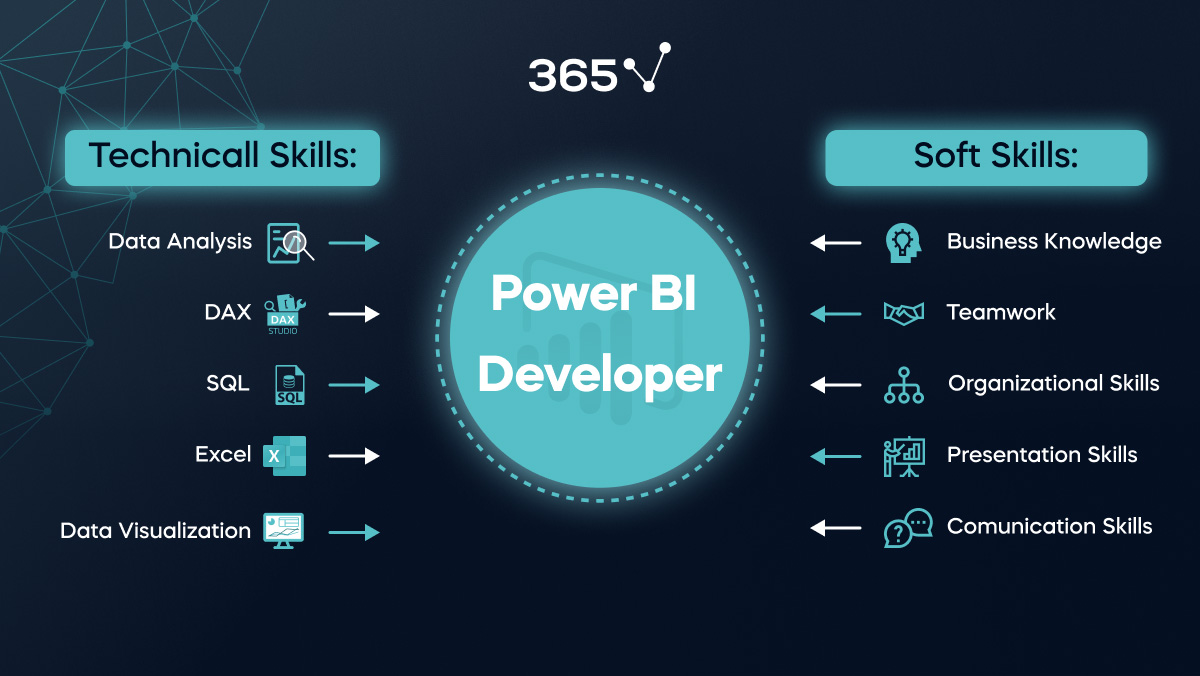
In 2026, the experts are not just dashboard builders—they are systems thinkers who understand data architecture, performance trade-offs, stakeholder communication, and business impact . Start with one powerful new skill—like mastering CALCULATE in DAX or building a star schema—and build from there.
Contact Us
Phone: +91 9667708830
Email: info@codingnow.in
Website: https://codingnowai.in/
Address:
2nd Floor, Kapil Vihar (Opp. Metro Pillar No.354)
Pitampura, New Delhi – 110034
Backlink to main website: Explore Python and AI courses at Coding Now – Gurukul of AI