Business Intelligence Roadmap: Warehousing, Dashboards, and Strategy
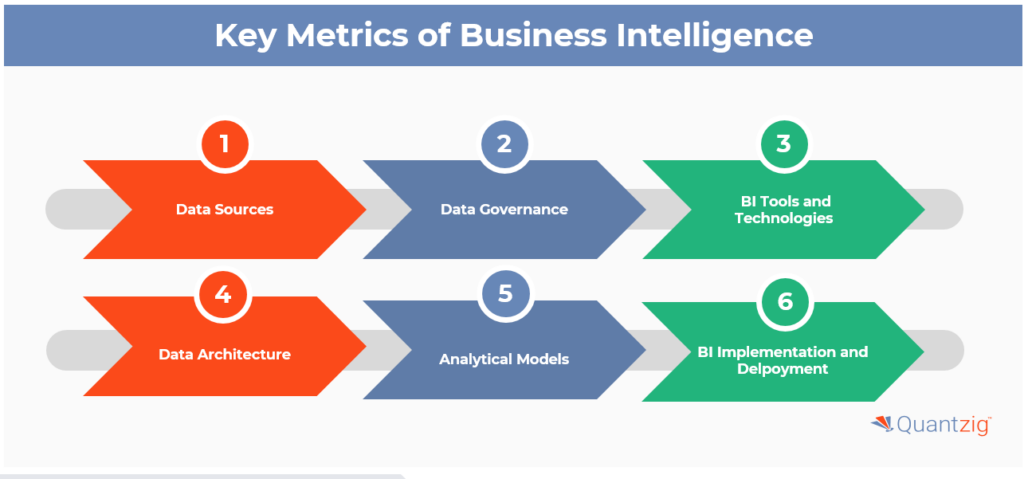
Business intelligence is only as valuable as the decisions it drives. A clear BI strategy ensures every dashboard, report, and data point serves a business purpose . This roadmap provides a structured path for building a successful BI practice.
Phase 1: Strategy and Foundation
Before building any dashboards, establish the groundwork.
Define Clear Business Objectives
Start with the end in mind. Translate high-level business goals into specific, measurable outcomes. For example, "improve marketing effectiveness" becomes "increase MQL-to-SQL conversion by 15% within six months" .
Assemble a Cross-Functional Governance Team
Establish a BI Competency Center (BICC) or data governance council with representatives from both business and IT. Their responsibilities include defining data standards, prioritizing projects, and ensuring compliance .
Build Your Data Glossary
Explicitly declare every business key, metric, and KPI to ensure everyone speaks the same language . This prevents teams arguing about definitions instead of performance.
Map Data Sources and Stakeholders
Identify where data lives—databases, flat files, CRM, marketing platforms—and who owns it . Specify exactly who will use the system and what they need to see.
Hands-on Task: Interview stakeholders across 3-5 departments to document their top 3 decision-making needs. Define 5-10 organization-wide KPIs with clear definitions and owners.
Phase 2: Data Architecture and Warehousing
A successful BI strategy relies on strong data foundations . The data warehouse is your single source of truth.
Medallion Architecture
Use the Medallion Architecture (Bronze, Silver, Gold layers) for organized, scalable data pipelines :
-
🥉 Bronze: Raw data ingestion
-
🥈 Silver: Cleansed, filtered, and conformed data
-
🥇 Gold: Business-ready, aggregated data optimized for analytics
ETL vs. ELT
Two patterns dominate: ETL (transform before loading) and ELT (load first, transform in the warehouse). ELT is popular now because modern warehouses scale elastically and let you version transformations .
Modern Data Stack Components
| Layer | Purpose | Example Tools |
|---|---|---|
| Ingestion | Capture data from sources | Fivetran, Matillion |
| Warehouse/Lakehouse | Centralize and store data | Snowflake, BigQuery, Databricks |
| Transformation | Version and test SQL models | dbt |
| Semantic Layer | Define metrics centrally | LookML, dbt MetricFlow |
| Visualization | Dashboards and exploration | Power BI, Tableau, Looker |
The semantic layer is where you make metrics reusable—define measures once and expose them consistently .
Hands-on Task: Design a simple warehouse schema for sales and marketing data. Map bronze (raw), silver (cleaned), and gold (business-ready) layers with at least 2-3 fact tables.
Phase 3: Analytics Systems
This is the backbone that turns raw data into usable insights.
Define Meaningful KPIs
Don't measure everything. Measure what moves . Establish a North Star KPI for each function. If a metric can't be tied to action, demote or drop it.
KPI Hierarchy:
-
North Star: High-level outcome (e.g., cash conversion cycle for finance)
-
Supporting KPIs: Explain why the North Star moves (e.g., forecast accuracy, inventory turns)
Build Repeatable Processes
Workflows must be repeatable and scalable . Document metric math clearly—what's the denominator in on-time-in-full? Document these in a data dictionary .
Governance and Security
Strong governance accelerates, not slows, analytics. Assign data owners, define access tiers, and establish a change management process for metric definitions . Track data lineage so you can answer: "Where did this field come from?"
Hands-on Task: Build a small data model (star or snowflake schema) for a sample business domain and document 5-7 KPIs with clear definitions and calculation logic.
Phase 4: Self-Service BI
Self-service means governed freedom, not chaos.
Hub-and-Spoke Model
-
Hub: Data team manages pipelines, certified models, and security
-
Spokes: Business analysts build domain-specific dashboards
Certified Datasets
Start with certified datasets—finance actuals, item master, open orders—so analysts build with confidence. Reserve sensitive tables for controlled access .
Measure Adoption
Track viewers, time-on-dashboard, refresh failures, and "last used" metrics. Stale dashboards no one opens are liabilities .
Phase 5: Dashboard Design
Dashboards aren't collages; they're narratives.
Design Principles
-
Lead with the decision the viewer needs to make
-
Start with 2-3 primary KPIs top-left
-
Use consistent scales and colors: Red = risk, green = acceptable, amber = attention
-
Avoid chart junk—if a table says it better, use the table with conditional formatting
-
Glanceability: Frontline supervisor should get 80% of value in 30 seconds
The 4-Layer Modern BI Stack Flow
-
Warehouse Layer: Single source of truth (Snowflake, BigQuery)
-
Semantic Layer: Business translator—defines metrics centrally
-
Visualization Layer: Dashboards and self-service (Power BI, Tableau)
-
Activation Layer: Putting insights into action (Reverse ETL tools)
Self-Service Considerations
-
Mobile layouts need bigger touch targets and fewer filters
-
Alerts for critical changes keep users informed
-
Forecasting helps users see what's coming next
Hands-on Task: Build a 3-page dashboard in your preferred BI tool—executive summary (KPIs), operational detail (trends), and drill-through (data exploration).
Phase 6: Implementation and Iteration
Agile Delivery
Don't build in a silo. Construct reports in consistent steps, present progress to stakeholders, gather feedback, and iterate. This continuous loop ensures final delivery aligns with business expectations .
Pilot Before Scaling
Start with a high-impact, low-complexity pilot project to demonstrate early value .
Measure ROI
Track both hard metrics (cost savings, revenue increases) and soft metrics (time saved on manual reporting, faster decision-making) .
Recommended Learning Resources
Courses and Certifications
-
Coursera: Business Intelligence Career Master Plan – BI roles, roadmaps, data modeling, visualization, and interviews
-
ISB Applied Business Analytics – 14-week program covering predictive analytics, Tableau, and GenAI
-
University of Bologna BI & Big Data – Covers data warehousing design and BI architecture
Books
-
Business Intelligence Career Master Plan – Launch and advance your BI career with practical techniques
Tools to Learn
-
Data Warehousing: Snowflake, BigQuery, Databricks
-
Transformation: dbt
-
Visualization: Power BI, Tableau, Looker
-
Semantic Layer: LookML, dbt MetricFlow
Final Thought
A successful BI roadmap is not a single project but a continuous plan aligning data initiatives with business objectives . Strong data foundations, scalable systems, and actionable dashboards deliver real results . Start with the business need, build a solid architecture, and design for users.
Behind every great dashboard is immense effort in data preparation, automation, and integration . Make that effort count.
Contact Us
Phone: +91 9667708830
Email: info@codingnow.in
Website: https://codingnowai.in/
Address:
2nd Floor, Kapil Vihar (Opp. Metro Pillar No.354)
Pitampura, New Delhi – 110034
Backlink to main website: Explore Python and AI courses at Coding Now – Gurukul of Ai